Infected Blood Inquiry: evidence and estimation

Case study developed in collaboration with Sir David Spiegelhalter OBE, member of the Infected Blood Inquiry Statistics Expert Group and Emeritus Professor of Statistics, University of Cambridge.
Summary
In the 1970s to the early 1990s, an unknown number of people were infected by contaminated blood transfusions or products under NHS care. This has been described as the greatest scandal in NHS history.
In 2017, the Infected Blood Inquiry was set up, headed by Sir Brian Langstaff, and part of its mission was to explore the scale of the scandal – how many people were infected, and how many died? However, data on blood donations, transfusions and infections was incomplete and fragmented. Statisticians had to build complex multi-stage models, collating multiple data sources and including assumptions at each stage.
In this case study we explore how the statistical expert team provided answers to the Infected Blood Inquiry, under intense public scrutiny in an area of heightened sensitivity, including weighing up the need for answers with challenging data limitations.
What was the problem?
Transfusions of contaminated blood (eg after surgery or childbirth) and treatment (eg of blood clotting disorders such as haemophilia) with contaminated blood products led to numerous people becoming infected and subsequently dying. Families were tragically impacted by illness, stigma and death.
At this time, blood donations were not screened. Viruses such as HIV (human immunodeficiency virus), hepatitis C and hepatitis B were just beginning to be discovered and screening programmes set up.
After decades of campaigning by affected groups, a public statutory inquiry was announced and set out to investigate the scale and impact of the scandal.
"The NHS had relied on imports of blood – for example from prisoners in the USA, where donors were paid for giving blood. This attracted people from groups who were more likely to have hepatitis or HIV. We were surprised to find out by interviewing those who were working on blood transfusion during this period that there were perverse incentives for donating blood in the UK, after 1985 when HIV screening was introduced – as people could get free and confidential HIV tests prior to donating. However, hepatitis still wasn’t being screened for – until 1991. This meant that people at high risk of having viral infections, eg current or ex-injecting drug users, were coming forward to generously donate blood, but were able to donate hepatitis-infected blood even if they were clear of HIV. All good statisticians must talk to the people involved to find out more about the context at the time. "
Questions that needed answering included how many people had been infected and how many subsequently died from infection-related causes. This was necessary to recognise and formally document the scale of the scandal, as well as to estimate how many people had been infected but remain undiagnosed. Data was fragmented and decades old, with many gaps, and so answering these questions required a complex statistical approach.
What was done?
The inquiry appointed a team of statistical experts, with a range of expertise in infectious diseases. They set out to investigate how many people were infected with, and died from HIV, hepatitis C and hepatitis B. Additional help was sought from experts in statistical programming, in order to construct the necessary complex models, perform multiple analyses and produce tabular and graphical output.
For HIV, the period between HIV infection and symptoms of the virus is relatively short and well documented, and there were existing registries and databases available. Although there were multiple sources of information and the team could triangulate, precise estimates were not possible due to gaps in the data sources. However, the team judged that the available evidence could answer the questions with moderate/high certainty.
For hepatitis C, the period between infection and symptoms is longer (with some symptoms eg liver scarring appearing only after 20–30 years) and there was no established source of data linking receipt of blood products with infection. To answer the question, the team had to split up the task into several sub-questions. They constructed a complex multi-stage model, to bring together different sources of data and incorporate assumptions based on the process and consequences of infection.
For example, assumptions had to be made around: the historical prevalence of blood donation; the proportion of infectious donations; the number of units transfused; the number of transfusion recipients who became infected (broken down by age and sex); and survival rates. You can read in more detail about the statistics involved in the inquiry, and take a look at a figure demonstrating the complexity of the model, in this explainer drafted by members of the statistical expert team. The team provided a confidence rating of ‘low/moderate’ for these estimates.
"Each stage was worthy of a PhD thesis – it was a huge amount of work, a massive model, and it had to be done in a number of months. The data was disparate and old, from the 1970s – we were having to look through handwritten notes and faxes containing 50-year-old transfusion information. This was worlds apart from previous work I had done in academia or on clinical trials, where you generally have reasonably complete data."
For hepatitis B, there was even less data. The team concluded that the data was too poor to support any meaningful analysis, and made the decision not to provide an estimate, since they had such low confidence that they could answer the questions posed.
What factors were balanced?
The team needed to provide answers, but the data was limited. They had to make assumptions and build complex models rather than being able to refer to existing figures. The team acknowledged that models and statistics are always imperfect representations of reality, and made sure to propagate the uncertainty associated with each stage through to the final result and carry out extensive sensitivity testing. They recognised that an estimate was more valuable than having no idea about the scale of the scandal.
The team wanted to provide ranges in answer to each part of the question rather than specific overall figures, to reflect the uncertainty associated with the estimates. The statisticians added corresponding confidence ratings to summarise their judgement of the extent that the available data could answer the question of interest, on a 5-point scale (low, low/moderate, moderate, moderate/high, high), to help convey certainty in this way. However, at the final stage, the Inquiry required the team to add up the numbers, which the team had initially been opposed to doing.
"Although we had to provide numbers in the end, we provided round numbers: 30,000 infected and 3,000 died. When people hear these round numbers they realise they are approximate.
We just had to do the best job possible, and where we realised that it wasn’t possible to provide an estimate, it was incredibly liberating to be able to explain why and say ‘no’. "
The statisticians also had to accept that some questions could not be answered, where the data was not of sufficient quality and the trade-offs involved in producing an answer would be too steep and lead to too great uncertainty in the result.
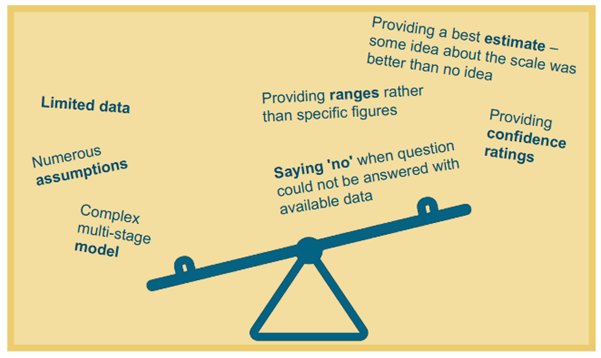
Infographic illustrating factors that had to be balanced.
What was the impact of these decisions?
Before this work, there had been a number of proposed figures for the impact of the scandal in terms of the number of people infected and deaths. Having an estimate was important to bring clarity to a decades-long debate about the scale of the scandal.
"This was a major step forward – people had been making claims about ‘millions’ of infections, and we were able to knock that down. We focused on the statistics, and kept from reading too much about the political context; it was a very hard-hitting area. "
Although no estimate can be perfect, this work has become accepted as the best estimation of the scale, and the figures provided – around 30,000 people infected and 3,000 deaths – have become the figures quoted throughout the media and in policy discussions, and have informed the government’s approach to compensation.
What are the key learnings?
The statisticians involved in this work used qualitative ratings to indicate confidence, and recommend that this is done more widely. Similar scales have been used by the Scientific Advisory Group for Emergencies (SAGE) during the Covid-19 pandemic and are beginning to be encouraged in government departments eg the Department for Transport’s analytical assurance statements and intelligence assessment analytical confidence ratings. The statistical team recognised that judgement is central to statistical modelling – in making assumptions, as well as to indicate confidence in the results.
This case study also highlights the importance of being able to say no, when the data is insufficient to be able to support confidence in the analysis.
The statisticians reflected on the importance of communication, and how they made sure to accessibly explain terms eg ‘confidence intervals’ and ‘uncertainty intervals’ in their report so that a non-technical audience could follow the findings.
"When the families of victims are sitting in the front row this puts a particular pressure on statisticians, in the way that work is communicated. We wanted to show that while evidence might sound cold and unfeeling, we fully recognised that each of these numbers comprises an individual tragedy. We spoke to the families afterwards. I remember one family member telling us that their father would have loved to hear this. "
The statisticians also had to present their findings in a court-room setting, with people affected and their families in the front row. The statisticians were determined to show compassion, explaining that numbers and graphs are ‘inevitably a gross, even harsh, summary of the suffering endured’ and that they recognised the human lives and suffering behind the numbers, but that it is only by summarising experiences that they could properly assess the magnitude of what happened. The team also set this out in their report (page 7). They demonstrated how when dealing with deeply sensitive issues, it is possible to acknowledge this and still convey technical messages.
In this instance, there was one team of statisticians modelling and using their expert judgement to shape the results. The team brought diverse expertise to the problem, and found that working together was a fulfilling experience. However, they suggest that perhaps in ideal circumstances there would be multiple teams working on the same problem, so that their results could then be compared and combined into a more robust result.
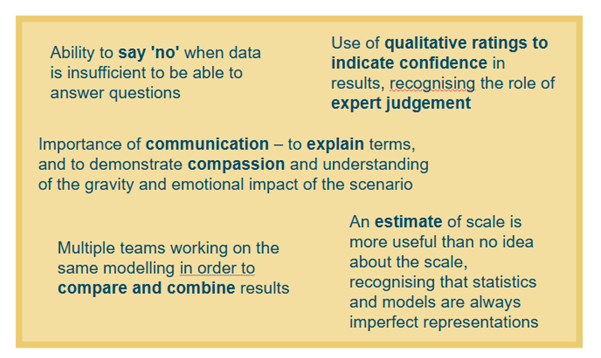
Infographic illustrating key learnings
David Spiegelhalter would like to acknowledge the huge contributions made by all members of the statistical team, particularly Sheila Bird, Ruth McCabe, Sarah Hayes, Stephen Evans and Christl Donnelly. This work was only possible through close collaboration with the Inquiry team, in particular Moore Flannery and Michelle Secker.
Resources