How do we know how many people have Covid-19? The Covid-19 Infection Survey
Case study developed in collaboration with Sarah Walker, Chief Investigator of the Covid-19 Infection Survey, Professor of Medical Statistics and Epidemiology at the University of Oxford, member of RSS Statistics Under Pressure steering group, and Heather Bovill, Deputy Director at Office for National Statistics, previously Head of Covid-19 Infection Survey Analysis.
Summary
The response a government and the public should take to a pandemic depends on the nature of the pandemic – how many people are infected, and what risk this poses. But when a new pandemic hits, how are we to know how many people have the virus? In the early stages of the Covid-19 pandemic, the Covid-19 Infection Survey (CIS) was set up to provide estimates of just this.
This case study details the pressures the team faced when rapidly working to set up a new survey to estimate infection levels in unprecedented times. We explore the trade-offs involved in deciding how best to provide timely results that were fit for purpose and robust enough to inform decisions, involving balancing aspects relating to survey set-up, representativeness, and communication of the results.
What was the problem?
At the start of the pandemic, the government needed information on Covid-19 infection rates quickly. This information was crucial to inform decisions about the pandemic response – how quickly was the infection spreading? What measures might need putting in place to help the country deal with the pandemic, depending on the scale of the issue?
There was some existing information on Covid-19 levels, such as management information from people who had taken Covid-19 tests. However, at the start of the pandemic, these tests were only available in hospital, so the only people being tested were severe cases. Tests did not become widely available until much later. Even then, this could only provide information about the people who were choosing to get tested – possibly because they suspected they might be positive. Information was needed on the whole population, including the people who were not choosing to test for a particular reason and people who had Covid-19 without symptoms who could still pass the virus onto others.
A survey is the gold standard for gauging what is happening across the population. Setting up a large-scale survey usually takes 6 months to 1 year, but information was needed urgently.
What was done?
The Office for National Statistics (ONS) formed a partnership with the University of Oxford, University of Manchester, UK Health Security Agency (UKHSA), Wellcome Trust, IQVIA (a contract research organisation) and several laboratories that could test samples. The partnership set out to design and conduct a survey to estimate infection levels in England (and later also covered the devolved authorities).
The team decided to start the initial pilot stage of the survey by approaching an existing database of people. These people had previously taken part in ONS surveys on different subjects (and had been selected at random to be approached to take part in these previous surveys). They had agreed to be approached about future studies and were expected to be more likely to say yes to taking part in this survey, meaning that results could come in more quickly. (And this expectation was correct – response rates were approximately 50%, which is higher than is usually expected when randomly selecting people to approach.)
However, this strategy meant that the survey was not initially as representative of the population as it could have been. The people who had agreed to be contacted about future research were, for example, more likely to be over aged 50 or living outside of London, compared with the general population.
The survey team then moved to inviting people to take part in the study based on address lists, to try to increase the size and representativeness of the study. However, these address lists only had information about the region that the address was in and its associated deprivation score, so these were the only factors the survey team could use to try to increase representativeness. They did not have information on other factors such as the age, sex, or ethnicity of the people living at the address – or even how many people lived there. In a further attempt to increase representativeness (with regards to the factors they had information on), the team sent more survey invites to areas where response rates were low.
What factors were balanced?
Timeliness was key, but the team also needed to make sure that the results would be robust enough to inform the pandemic response.
"We had daily hour-long meetings to discuss how to progress forwards and weigh up various trade-offs. At first daily meetings seemed extreme, but it seemed like there was never enough time to discuss everything."
When considering how the partnership was set up, in usual times there likely would have been a tendering process. But at the start of the pandemic, the need for data meant that were wasn’t time for this and partners were chosen for pragmatic reasons. For example, IQVIA had furloughed staff who would be immediately free to help collect blood samples for antibody testing, and there was a need for a partner with experience in sponsoring medical studies that involve human samples (which require National Health Service Research Ethics Committee and Health Research Authority approvals).
One of the main areas in which trade-offs had to be weighed up was how to approach people to participate in the initial stage of the survey, when getting it off the ground. There was not sufficient time to follow the standard procedure of random sampling to set up the survey, so the team had to instead weigh up which method of inviting people to take part would provide results that were robust enough to inform decisions within the necessary timeframe. They had to decide how it would be most valuable to focus their efforts to begin with, and how they could then look to adjust methods when capacity allowed – ie beginning with an existing list of people who had been selected at random to take part in previous surveys and had agreed to be approached again in future, and then aiming to improve representativeness.
There were also trade-offs around which data to publish and how to communicate the findings of the survey. The team needed to balance keeping the key messages clear and easily comprehensible with including the context and the limitations of the statistics, so that everyone understood the uncertainty around the estimates.
One example of trade-offs around communicating the results comes from trends in the percentages of people testing positive for Covid-19. There was interest in knowing if these rates were going up or down (rather than just the absolute numbers), but these estimates were quite unstable at the start. The team did not want to publish statistics that were not robust and may change, and therefore held off on publishing these until they developed a better way to communicate the uncertainty around the estimates (reporting the probability that positivity rates were higher or lower than estimates from previous weeks, using Bayesian methods). Another example relates to the publication of sub-group analyses, which were only published when the survey had sufficient data to ensure these were robust, along with sufficient capacity to quality assure them.
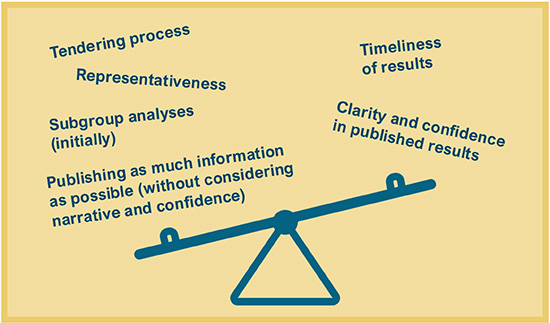
Infographic illustrating factors that had to be balanced.
What was the impact of these decisions?
The timely results from this survey meant that data from the community could be at the heart of the decisions around going into or reopening from lockdowns, and what should be allowed regarding retail and non-essential activities.
However, prioritising timeliness in this way also meant that the team faced some backlash from the statistical community. The gold standard for surveys is random sampling, and the decision to use a pre-existing list due to time constraints at the start of the survey (for around 10% of the total participants) did not land well with some statisticians. Parts of the statistical community were concerned about the representativeness and value for money of the survey.
"We could have taken a different route, and this may well have resulted in more accurate and representative estimates. But if that route took longer, what use would the results have been if they were only ready after decisions had to be made?"
The team reflected on alternative routes they could have taken to set up the survey quickly. For example, using GP-list based sampling, or linking address lists to the most recent Census to get more information on participants’ characteristics. However, there were also challenges associated with these routes – for example, the most recent Census was almost 10 years out of date when the pandemic hit.
What are the key learnings?
Working in collaboration helped bring together expertise in different areas, in order to discuss which routes to pursue.
"Working in collaboration worked well – it helped to reduce the risks of our decisions as we had in-depth discussions about all of the trade-offs. We are really proud of how quickly we set this up to allow our results to play a crucial role in informing the pandemic response."
Having some wording pre-prepared to explain what the team did and why would have been helpful in communicating the survey methods and findings. Having this content easily accessible could have avoided the need to spend significant amounts of time responding to individual concerns and queries, freeing up more time to work on the project itself.
The team also pointed towards the need for contingency planning in order to be aware of skills that may be missing from the team and where external expertise may be needed. For example, in the early stages of setting up the survey, the team had to grapple with a barrage of new information coming in (about the medical context of the study, eg what all the different tests were, what the test results meant, what kind of information should be collected to inform statistical models with medical outcomes) and had to spend time working out what was what and how to put things together. Having a medical data processing expert on hand to support, or having thought beforehand about how to develop a system to process this type of data, would have been helpful. Working in collaboration with subject experts – academics who could upskill the ONS teams in epidemiology modelling techniques – was also key and should be considered as part of contingency planning for the necessary skills.
Contingency planning can also be helpful to consider ways of working in fast-paced situations – when results are needed as a priority, but it is also necessary to continue developing the underlying infrastructure and processing pipelines that underpin the results. For example, the team found it helpful to separate out a ‘rapid production’ sub-team from a team that worked on backend development, to help avoid falling behind on building robust data processing systems while delivering results on time.
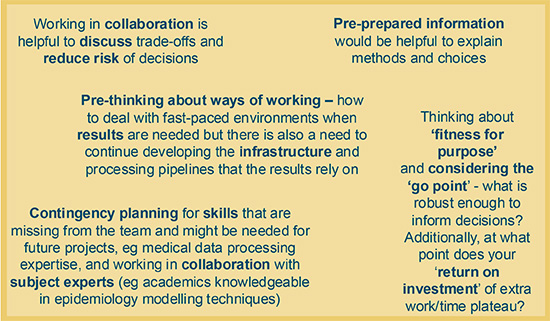
Infographic illustrating key learnings.