Furlough statistics: producing statistics for a new policy at pace
 Case study developed in collaboration with Kate Sweeney, Deputy Director, HM Revenue & Customs (HMRC).
Summary
The Furlough Scheme (formally known as the Coronavirus Job Retention Scheme, CJRS) was introduced at the start of the Covid-19 pandemic. It was a new scheme, designed to support businesses impacted by the pandemic. The Furlough scheme was an area of debate, and there was great demand for information on how many employees and businesses the scheme was supporting and its costs.
This case study explores how HMRC had to work at pace to provide statistics on the Furlough scheme, setting up novel data feeds and processing pipelines from scratch, and facing challenges with data formatting and linkage. We explore how the HMRC team had to balance competing demands, considering how best to focus limited resources to provide rapid information on the scheme.
What was the problem?
The Furlough Scheme aimed to help businesses impacted by the pandemic to retain their employees by paying 80% of their employees' salaries. The scheme was announced in March 2020, and launched just one month later. It was designed at great pace and needed brand new IT systems, data feeds and processing pipelines putting into place to collect data on the scheme.
From the start, there was huge demand for information about how many employees and businesses were being supported, the cost of the scheme, and the impact on the UK economy. The Furlough scheme was an area of polarised debate, with a wide range of views on its suitability and effectiveness.
There were other sources of information in the public domain on furlough and the impact of Covid-19 on businesses, from smaller surveys. It was important that HMRC made the full furlough data available so that the complete picture could be seen.
The scheme also evolved over time: data was needed to inform policy choices about factors such as changes to eligibility and generosity, and it was important that the evidence behind these decisions could be transparently communicated. Ministers wanted to make statements to inform the public about how the scheme was operating, and the team at HMRC needed to make sure the data behind those statements was available.
What was done?
To address the immediate demand for numbers, the HMRC team first put out high-level management information from administrative systems (the number of businesses claiming for furlough expenses, the number of employees furloughed, and the total cost of the claims). This was initially put out on Twitter daily, and then weekly on gov.uk.
The team realised that publishing more detailed information would be helpful, including characteristics such as the age, sex, and location of the claimants. They therefore started the process to develop an ‘Experimental Official Statistics’ release.
The team took the data that businesses submitted, cleaned it, and linked it to other datasets they already held in order to see claimants’ characteristics. One of the biggest challenges was with the quality and format of the data they were receiving. For the largest businesses, data was received in all sorts of formats – it was not always machine readable and then had to be manually processed by the team, which was time consuming.
The scale of the data was also a big challenge, with tens of thousands of new claims being submitted every day at the start.
What factors were balanced?
The team knew that timeliness was the most important factor in this instance, as this data was needed to inform decisions that HM Treasury ministers were making about the evolution of the policy, as well as to inform public debate.
"There were some trade-offs around the level of detail we could produce, the completeness of the data on first publication and some stylistic elements which improved over time, such as adding more visualisations. However, having a robust set of official numbers that could be used by ministers and others as part of the important public debate was essential and valued."
They decided to focus on a smaller subset of characteristics for the first release, and add additional breakdowns (such as age and sex) in later releases as capacity allowed – the first release had just five tables, while the final release in December 2021 had 44 tables.
After the original submission of each claim, the team worked to resolve any issues concerning missing data or data that failed quality assurance checks. The corrected data was fed into the statistics production process as soon as possible, with revisions to the monthly statistics series where required. For example, there were over one million furloughed employees with an unknown region in the first release, but the team managed to reduce this to 100,000 by the third release.
There were also decisions made at a departmental level to pause or delay non-essential work during the pandemic, meaning that analysts could focus on urgent issues.
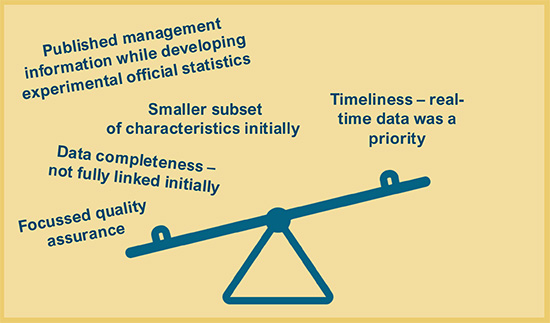
Infographic illustrating factors that had to be balanced.
What was the impact of these decisions?
Prioritising timeliness over detail meant that there were unanswered questions in the first few releases. However, the team was able to add more information over time, prioritising the breakdowns that were most in demand.
"A big take-away was showing what can be achieved in times of crisis. Official Statistics were published much more quickly than would typically be the case with a new system or policy – it usually takes many months or even years to develop a series, and we achieved it in just a few months."
Prioritising the monthly release also meant that the team had to make revisions most months, as they matched more data and added in late claims. This meant the figures changed. However, the team monitored these revisions: the headline story remained consistent, and the first release data was always a reliable reflection of the scheme in close to real-time.
Before the team began to publish the monthly release, they had to answer a large number of ad-hoc individual requests, including Freedom of Information (FOI) requests. Publishing the information as per the Official Statistics protocol, with scheduled and pre-announced releases, meant that they could mitigate many of these by pointing towards the planned releases. This kept demands on the analytical teams manageable, and meant that the same information was out there for everyone to see, rather than being shared with select individuals or groups at different timepoints, which may have led to confusion or misinterpretation of the figures.
What are the key learnings?
A few weeks after the furlough scheme launched, another scheme called the Self-Employed Income Support Scheme (SEISS) was launched. The team was able to learn from their experiences with the Furlough scheme, and began publishing management information immediately while planning for an Official Statistics release.
Prioritisation was key. The team had limited time and resources, and so needed to focus on the most important aspects – in this case, a core set of monthly statistics – and ensure they delivered on this, leaving less critical parts until later. They did as much as they could in the time available before each release.
One factor that made this work especially tricky was the lack of data processing system in place, and so the inconsistent format in which data was received initially. In the future, it would be helpful if data collection could be considered along with the policy development, including, for example, specifying a consistent format or providing a template to input data. IT capacity was also a limitation as the team were working with massive datasets.
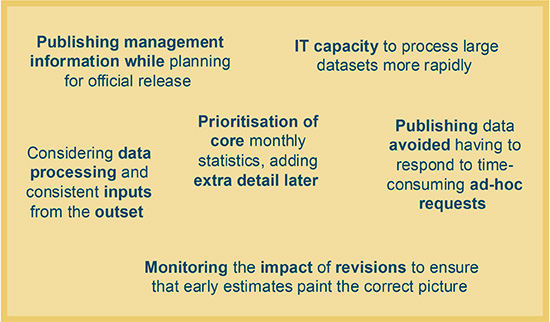
Infographic illustrating key learnings.
Resources
HMRC coronavirus (COVID-19) statistics - GOV.UK (www.gov.uk)