Definitions and devolution: harmonising homelessness data
Case study developed in collaboration with contacts working on homelessness statistics across the Government Statistical Service (GSS).
Summary
People who experience homelessness are often some of the most vulnerable people in society. Data on this population is valuable – to understand more about the experiences of this population and to inform policies to support them.
To assess levels of homelessness and the effectiveness of policies, it can be helpful to make comparisons across the UK. However, homelessness is a devolved policy area: each of the four nations has developed different priorities, policies and legislation to meet the needs of their own populations. This has resulted in differences in the data that is collected.
In addition to this, there are a range of challenges inherent in collecting data on people experiencing homelessness. These include: the challenges of counting a moving population; a possible reluctance to engage with data collection methods from this community; and the different definitions of ‘homeless’ (from ‘rough sleeping’ to ‘sofa surfing’ to inadequate housing).
In this case study we explore how cross-government collaboration has been crucial to improving the coherence of UK homelessness statistics – working to increase understanding of the outputs and the wider context, improve the accessibility and navigation between outputs produced across the UK, and work towards alignment of homelessness data where it is feasible to do so. We explore the trade-offs involved in improving the coherence of homelessness statistics, for example balancing time and resource implications with value and impact, as well as considering the feasibility and suitability of changes to achieve harmonisation.
What was the problem?
Comparing homelessness statistics across the UK is challenging as direct comparisons can often not be made. Homelessness is a devolved policy across the UK, with each country having their own legislative framework, developed to suit their own context and needs. Each country collects data and produces statistics according to their own framework, resulting in differences in definitions, data categories and reporting timelines.
As an example of differing definitions across the UK nations, people must be ‘threatened with homelessness’ within
56 days to be eligible for support in England, while in Northern Ireland it is
28 days. In Scotland and England, local authorities collect and submit more granular (case-level) data, while in Wales the information submitted is aggregated (although efforts are underway to
move towards case-level data collection). There are also differences in the economies and demographics of the different nations, which may also influence levels of homelessness and the effectiveness of policies aimed at reducing homelessness.
In addition, ‘homelessness’ is a broad term and people can experience many different types of homelessness. People ‘sleeping rough’ might be the most visible form of homelessness, but other forms include, for example, people living in temporary accommodation, in insecure housing (eg under threat of eviction) or in other forms of inadequate housing (eg overcrowding or without basic amenities). This can further complicate the ability to compare different data on this population, due to the different definitions relating to different forms of homelessness.
There are also challenges relating to collecting data on people experiencing homelessness. This can be due to a range of reasons: it can be difficult to count or contact individuals who have no fixed address or who regularly change address; people experiencing homelessness may be reluctant to engage with services or data collectors – which may be due to distrust, past trauma or fatigue; or there may be language or literacy barriers. Some people may not consider themselves to be homeless, even though they fit the legal definition. Others may try to hide away, for example to protect themselves. This ‘
hidden homelessness’ means it is challenging to collect data and draw conclusions on this population.
What has been done?
Faced with the challenges above, GSS teams within the Office for National Statistics (ONS) and across the UK have collaborated on a range of initiatives to improve the landscape of homelessness statistics across the UK. Their work aims to improve the coherence of homelessness statistics and to help explain the similarities and differences (what can and cannot be compared) to relevant users.
- In 2018, a cross-government housing statistics steering group was formed, followed by a working group on homelessness the subsequent year – providing a dedicated focus on this subtopic of housing statistics. The GSS Homelessness and Rough Sleeping Statistics Working Group has representation from the key producers of homelessness statistics across the UK, as well as from other stakeholders across the GSS with an interest in these statistics. The group aims to increase collaboration at the working level, to improve understanding and build a more coherent picture of homelessness statistics across the UK. The group develops and implements the annual GSS work programme on homelessness, including reviewing existing statistics, considering gaps, priorities and user demands, and sharing best practice. The GSS Housing Statistics Steering Group (composed of more senior representatives from the involved organisations) provide steer to the working group.
- In 2019, the GSS Harmonisation Team (which deals with harmonising standards across all topics) undertook work to explore the feasibility of harmonising definitions of homelessness UK-wide. No simple fix was found. The Harmonisation team recommended further consideration of how to overcome the barriers to harmonisation, along with the associated costs of this.
- The GSS developed a homelessness statistics interactive tool to help users understand and compare official statistics on homeless across the UK. The tool aims to explain the different definitions of homelessness, the different processes to apply for support, how this affects data collection, and which data can and cannot be compared across the nations.
- Aiming to provide more in-depth analysis to help users navigate homelessness statistics, the ONS has published articles assessing the comparability and coherence of existing government data on homelessness (2019) and rough sleeping (2021). Where possible, the team brought together the data from the separate UK nations to present Great Britain or UK figures.
- The GSS team has also produced a number of supporting blogs to explain arising issues, for example explaining how the Covid-19 pandemic exacerbated a methodology gap between the official homeless deaths statistics for England and Wales and for Scotland (2022).
- Teams at the ONS have also published a range of research exploring homelessness across the UK that would not have been possible without cross-government collaboration, for example summarising existing UK data and highlighting gaps around “hidden” homelessness; exploring the characteristics of people experiencing homelessness within the Census 2021 data; and exploring the quality of administrative data in capturing the experiences of people experiencing homelessness.
What factors were balanced?
Working to improve the comparability of homelessness statistics involves considering factors such as the time- and resource-intensive nature of this work, along with its value, feasibility, and impact.
Exploring the differences between the devolved nations is often
time-consuming, requiring in-depth exploration of policies, data definitions, and data collection methods.
Resource capacity must be considered – both in terms of the
teams driving this work, and also in terms of the
implications of any changes to data collection methods. The time and capacity investment of carrying out this work therefore has to be balanced against
other activities and priorities – ensuring effective use of government resources.
The
value of the work to the stakeholders involved, as well as more broadly, must be considered. While many stakeholders see the value in comparable statistics, some may be less convinced that the challenges involved are worth the considerable effort and investment needed to overcome them. The different nations, departments, devolved governments and other organisations involved (or with an interest) in this work may have
different outlooks on the relative importance of coherence.
It can be challenging for data producers to
weigh up the pros and cons of harmonisation when these are on different
timelines or
scales. For example, overcoming the challenges could have short-term impact (eg relating to costs or resourcing) for a nation, while the benefits it could reap – eg at a cross-UK level – may be further in the future. While homelessness is seen by many as an ongoing crisis, there has been no acute, single event to act as an
impetus to drive change.
The
feasibility of UK-wide data must also be considered: homelessness definitions are entrenched in
legislation and are therefore challenging to change, as legislation evolves slowly and requires political party backing to be altered. Legislation and priorities also change over time with the
political landscape – and change differently in the different nations, at different times. Data producers must also be conscious that future changes to the political landscape might impact the coherence of homelessness statistics.
In addition, it is necessary to consider whether
common methods are necessarily the best solution or not, as they may be associated with
drawbacks in some instances. As an example,
England & Wales and
Scotland both look at location information on death certificates in order to count deaths in homelessness. Scotland has a comparatively small number of local authorities (around 30) and can have direct contact with them to investigate any ambiguities – resulting in more robust and quality assured data. In contrast, there are over 300 local authorities in England, meaning that it is not possible for England to do this. Moving towards consistent methodology would either involve advocating for unreasonable (and unachievable) levels of resourcing for England, or reducing the quality of data in Scotland.
For different aspects of homelessness statistics, these factors may have different weights – for example resource considerations may be a main consideration in some areas, while feasibility might be a main consideration in other areas.
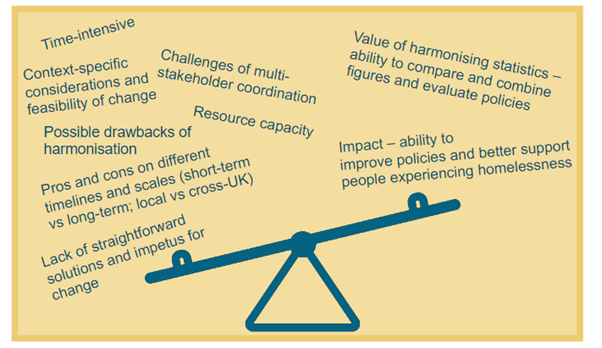
Infographic illustrating factors that had to be balanced.
What was the impact of these decisions?
This work has led to increased
collaboration across the four nations of the UK, improving cross-team communication and sharing of best practice. It has provided the opportunity to involve relevant
stakeholders in the future of cross-UK homelessness statistics, and has provided
momentum and accountability to enable the work to progress.
While devolution means there are challenges in comparing data directly, cross-government collaboration has shown that there are many opportunities for
further understanding on how homelessness statistics fit together across the UK. The work to date has furthered understanding on the similarities, differences, and comparability of a range of homelessness statistics and has produced a range of new insights about cross-UK homelessness data. It has helped
users deepen their understanding, minimising the risk of inappropriate direct comparisons being carried out and used to draw incorrect conclusions.
This work is leading to
continued progress and ongoing plans to improve the comparability and quality of homelessness outputs. This includes those outlined in the
cross-government housing and planning statistics work programme, for example developing homeless deaths statistics in Northern Ireland to also be based on death registrations.
What are the key learnings?
The homelessness statistics landscape is complex due to the wide range of stakeholders involved in producing statistics and the wide range of data that exists. This has meant that a range of
different workstreams have been necessary to explore different but related aspects of homelessness and help build a fuller picture.
Historically, it has not been within one government’s
remit to have full ownership of cross-UK homelessness statistics, and this has meant that coherence and harmonisation work has not always been prioritised. Forming a
group with dedicated responsibility and ownership of this area has been crucial to coordinate work and progress in this area.
Collaboration and cross-team working have been key, as has understanding the
needs, priorities and challenges of different stakeholders (and other interested users) in order to inform the workstream priorities and aims. For example, understanding more about the value placed on comparable statistics and the challenges of achieving this to be able to weigh these factors up.
Resource is also a key factor – direction from senior levels is needed to enable the resource, time and staff to develop this work.
Training and staff development/
upskilling may also be needed – for example to enable continuity despite the movement of staff with particular expertise (for example in coding – to support live platforms – or with knowledge of a specific area).
The team also reflected on the importance of
clear communication. Ensuring that explanations about which data can and cannot be compared is crucial to minimise the risk of misinterpretation or inappropriate direct comparisons (and therefore incorrect conclusions) being made, about, for example, which nations have higher levels of homelessness.
Finally, the team reflected on the
barriers to change, including how homelessness statistics are shaped by the differing
contexts of the four nations and by
factors outside of government statistics (eg legislation and policy) that are challenging to influence. In contrast to some other situations (eg some of the other
Statistics Under Pressure case studies), in this instance there is no ‘urgent crisis’ (eg the Covid-19 pandemic) that leaves no alternative apart from to change and accept trade-offs.
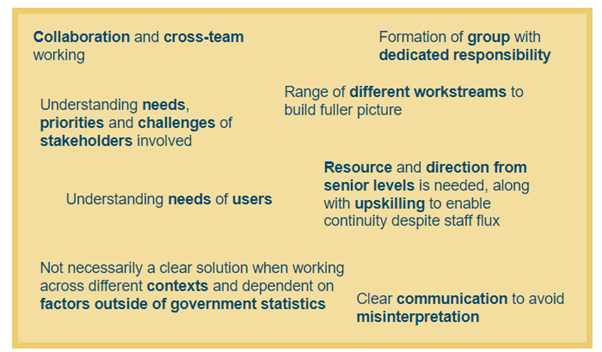
Infographic illustrating key learnings.
Resources
- GSS Harmonisation Team: Harmonisation of Definitions of Homelessness for UK Official Statistics: A Feasibility Report, February 2019
- GSS Harmonisation Team: Homelessness harmonisation guidance, April 2019
- ONS: UK homelessness: 2005 to 2018 – Assessment of the comparability and coherence of existing UK government data sources on homelessness, September 2019
- ONS: Improving homelessness and rough sleeping statistics across the UK - Initiatives across the Government Statistical Service to improve statistics on homelessness and rough sleeping in the UK, up to and including the 2021 Census, September 2019
- ONS blog: The emerging picture of UK homelessness and rough sleeping, September 2019
- OSR blog: Understanding rough sleeping during a pandemic, October 2020
- ONS blog: Understanding the impact of the Coronavirus pandemic on housing and homelessness, February 2021
- Government Analysis Function (GAF) blog: The comparability and coherence of UK homeless deaths statistics, November 2022
- ONS: People experiencing homelessness, England and Wales: Census 2021, December 2023
- GAF: Housing and planning statistics: 2022 to 2023 work programme, last updated December 2023
- GAF: Housing, homelessness, rough sleeping and planning statistics, March 2024
- GAF: Housing and planning statistics: 2023 to 2024 work programme, last updated March 2024