RSS Statistical Ambassador, Dr Anthony Masters, looks into the results of our statistical literacy survey of MPs
Back in 2011, Ipsos MORI conducted face-to-face surveys with MPs. Between 1st November and 20th December, interviewers asked 97 MPs a question about statistics: 'If you spin a coin twice, what is the probability of getting two heads?'
Parliamentarians could choose 15%, 25%, 40%, 50%, 75%, or offer another answer. MPs could also say they did not know. The two tosses of a fair coin are independent events. That means you should multiply the two probabilities: 50% times 50% is 25%.
A decade later, the Royal Statistical Society commissioned Savanta ComRes to examine the statistical knowledge of MPs again. This online survey asked 101 MPs between 17th November 2021 and 18th January 2022. This time, the wording was: 'If you toss a fair coin twice, what is the probability of getting two heads?'
About one in two MPs (52%) selected the right answer. Surveys provide estimates, which can differ from true values for many reasons. One of these reasons is ‘sampling error’: divergences through random chance of selection. This is the inherent cost of running a survey rather than a census.
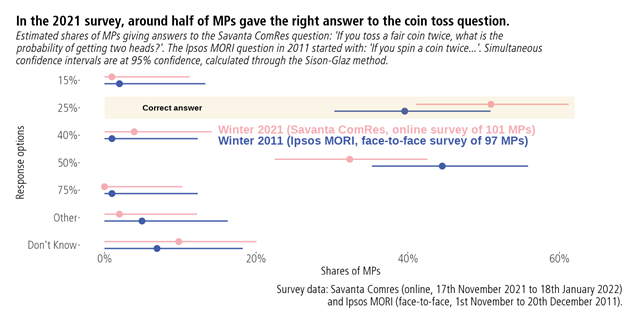
Think of a plausible range around each value, rather than focussing on a point estimate. We can calculate intervals around each estimate, due to sampling error. For the correct answer of 25%, one method of producing these intervals gives:
- Winter 2021 (Savanta ComRes): 52% (41% to 61%)
- Winter 2011 (Ipsos MORI): 40% (30% to 51%)
Even with stringent assumptions, the difference between these two proportions has a wide interval of uncertainty, between -1 percentage points and 24 points. That interval assumes that our surveys are simple random samples of a finite population of 650, with a normal approximation. 95% confidence or credibility is a convention, and lower levels shrink the resulting interval. An improvement in MPs getting the right answer between the two surveys is likely.
There was a modest difference in Conservative and Labour MPs getting the correct answer, at an estimated 50% and 53% respectively. The plausible ranges for sub-samples are even wider: a small gap could be down to sampling alone. Other methods for estimating uncertainty are available, such as Bayesian modelling and bootstrapping. Social research companies can use different wordings and modes, draw from distinct frames, and apply disparate weights. That can lead to systematic gaps in estimates between companies, called house effects.
In the Savanta ComRes survey, there were two further questions:
- Question 2: Suppose you roll a 6-sided die. The rolls are 1, 3, 4, 1, and 6. What are the mean and mode values?
- Question 3: Suppose there was a diagnostic test for a virus. The false-positive rate (the proportion of people without the virus who get a positive result is one in 1,000. You have taken the test and tested positive. What is the probability that you have the virus?
For the second question, there were open text boxes for respondents to input. There was also an option to say they did not know. The third question had the response list: 99.9%, 99%, 1%, 0.01%, ‘Not enough information to know’, and ‘Don’t know’.
Constructing a short battery of questions to measure statistical literacy is challenging. There are different conceptions of what it means for a person or societies to be ‘statistically literate’. It is hard to assess statistical thinking and contextual understanding, especially without full examinations.
In the dice question, around two-thirds of MPs (64%) inputted the correct answer of mean of three. The mean is often referred to as the average: the sum of the values, divided by the count. In this case, the sum of the five rolls is 15, so the mean is three. A similar proportion (63%) typed the right mode of one. The modal average is the most common roll, which out of those five rolls is one.
The third question was pertinent to the pandemic. The probability of infection after testing positive is the positive predictive value. You need three pieces of information to calculate this probability: the false-positive rate, the false-negative rate, and viral prevalence. For this question, about one in seven MPs (16%) gave the correct answer of ‘Not enough information to know’.