RSS statistical ambassador, Dr Anthony Masters, looks into the results of our statistical literacy survey of the general public.
To go with the survey of MPs, the Royal Statistical Society also commissioned a public survey. Opinium collected 2,001 responses from UK adults between 17th and 21st December 2021. Researchers weighted internet panel respondents to reflect the national adult population. The weights were by gender, age, region, social grade, and employment status.
The questions were the same as for the parliamentarian survey:
- Question 1: If you toss a fair coin twice, what is the probability of getting two heads?
- Question 2: Suppose you roll a 6-sided die. The rolls are 1, 3, 4, 1, and 6. What are the mean and mode values?
- Question 3: Suppose there was a diagnostic test for a virus. The false-positive rate (the proportion of people without the virus who get a positive result) is one in 1,000. You have taken the test and tested positive. What is the probability you have the virus?
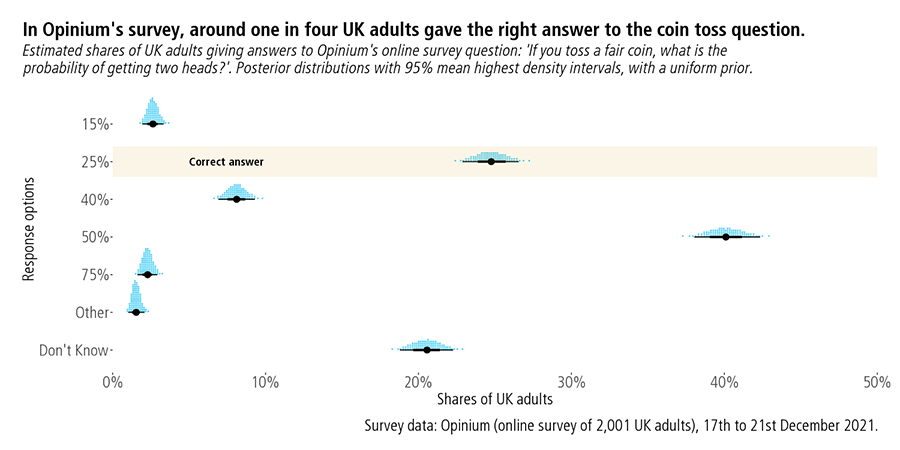
Around one in four (25%) adults gave the correct answer of 25% for the coin toss question.
For the second question, an estimated one in four entered right answers for mean and mode dice rolls. Given those rolls, the mean value was 3 (15 divided 5) and the most common -- the mode -- was 1. For the third question, about three in 20 adults (15%) chose ‘Not enough information to know’.
These estimated figures were lower than the sampled share for MPs. For that last question, the difference between MPs and the public is small. That could be due to sampling error alone.
Surveys provide estimates, which can differ from true values for many reasons. Researchers can use different wordings and options, seeking to measure the same concept. Different modes, frames, and weights can give different estimates.
What about the uncertainty in these estimates? In analysing the survey of MPs, I used a classical approach. This time, let’s use a Bayesian method. This statistical framework rests on the idea that probabilities are degrees of belief. Analysts then use the language of probability to describe uncertainty in unknown numbers.
Bayesian analyses start with a prior distribution, before data collection. We want to estimate what shares of adults would give different answers to the coin toss question. There were seven response options: 15%, 25%, 40%, 50%, 75%, Other, and Don’t Know.
Let’s pick a non-informative prior distribution. This is where all possible combinations have the same chance. We encode that prior in a Dirichlet distribution: all its parameters are equal to 1.
Next, comes our data, to update these beliefs. When there are only two options, analysts say the data comes from a Binomial distribution. With seven possible options, this is Multinomial data. We need the number of respondents giving each answer, such as 496 adults choosing ‘25%’.
The goal is to get the posterior distribution, after the data. Given our choice of prior distribution, there is a simple updating rule. The posterior distribution is also of the Dirichlet form. The prior and posterior distributions are in the same family. That means the prior distribution was special: a ‘conjugate prior’ for the likelihood.
For each parameter, the rule is to sum the ‘prior’ value with the ‘data’ value. The parameter relating to the correct answer share is then 497 (496 plus 1). We have our posterior distribution. It means we can express uncertainty due to sampling:
- Correct answer of 25%: 25% (23% - 27%)
- Incorrect answer of 50%: 40% (38% - 42%)
The interpretation of these credible intervals is natural. There is a 95% probability that the share choosing the right answer lies between 23% and 27%.
More complex models could reflect uncertainty from survey weights and other sources. Choosing different prior distributions and different models gives different posterior distributions.