Explainer: How local warming is related to global warming – pattern scaling
Our previous explainers discussed how global average temperature is defined and showed how a small increase can lead to a disproportionate increase in extreme events. This explainer looks at how global warming is felt very differently in different parts of the world.
1. When the global average temperature increases, does the temperature increase by the same amount everywhere?
The global average temperature increase is simply a spatial average of air temperatures measured over land, sea and ice across the planet. Temperature increases, however, vary considerably across the globe. While one area may tend to warm up twice as fast as the global average, another will only warm up at half the global rate. This is an important issue for countries and communities interested in knowing what warming can be expected locally in order to be able to adapt and mitigate the impact.
Through the analysis of historical data and climate model simulations, scientists have observed that local warming due to climate change remains proportional to global average warming, but with constants of proportionality (scaling factors) that vary spatially. In general, the scaling factors are greater over land than ocean, and greater at higher latitudes and in the interior of continents. This property, whereby local warming scales with global mean warming, is known as pattern scaling (see Q4 for references).
2. Which locations consistently warm more or warm less than the global average?
Figure 1 shows an estimate of the scaling pattern for annual mean surface air temperature. In general, warming is much lower over the oceans than over land. Since the ocean covers about 70% of the earth’s surface, this implies that temperatures over land are warming more than the global average temperature. Warming also tends to be greater further inland than close to the coasts. Furthermore, the warming is greater at higher latitudes than in the tropics, substantially so in Canada and Russia. Finally, warming is much greater in the Arctic than in the rest of the world, at around three times the global average warming. This has important implications for the future melting of Arctic sea ice.
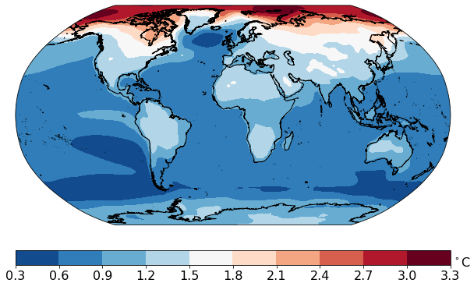 Figure 1. Spatial pattern showing the local warming per degree of global mean warming. This was obtained by calculating (on a 1° latitude-longitude grid) the ratio of the local temperature increase to the global average temperature increase between time periods 1980-99 and 2080-99 in the mean temperatures simulated by the CMIP5 set of climate models. [Source: Chen et al. 2022].
3. Can pattern scaling be used to project future temperature increases for any location?
Pattern scaling provides a simple method for making climate projections of local temperatures. Two local examples of the resulting projections are shown in Figure 2.
Average temperature in London had warmed by 0.9°C in 2015 since pre-industrial levels, and climate models predicted that it would reach 2.7°C by the end of the century, an increase of 2.7-0.9 = 1.8°C. Over the same period, global average temperature was predicted by climate models to rise from 1.2°C to 2.8°C, an increase of 1.6°C. Thus, the ratio of change for London is 1.8/1.6 = 1.125, and so London is projected to warm about 12.5% faster than the global average.
A different story emerges for Moscow, which is further inland and to the north of London (at a latitude similar to Edinburgh). We would therefore expect faster warming there than in London, and indeed that’s what we observe. By 2015, the temperature in Moscow had already warmed by 1.5°C, and it was projected to warm by 4.3°C by 2100. A similar calculation to the one for London shows that ratio of change for Moscow to be 1.75, indicating much faster warming for Moscow than for London or for the global average.
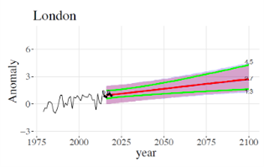
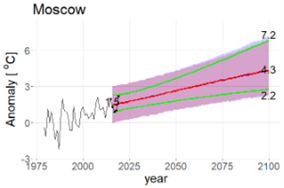 Figure 2. Projected temperature change for London and Moscow. The red line shows the projected temperature change using the pattern scaling method. The shaded area shows the likely range, or 90% prediction interval. The green lines show the likely range taking account only of uncertainty due to the trend and ignoring random year-to-year climate fluctuations. The black line is the historical temperature anomaly for 1979-2015, while the black dots represent observed temperatures for 2015-2019. The numbers along the right side of each panel represent the median, 5th and 95th percentiles of projected temperature for 2100. The numbers 0.9 and 1.5 shown are the temperature anomalies for London and Moscow, respectively, in 2015. [Source: Chen et al (2022)].
4. Where can I find out more about pattern scaling?
There are many published articles about pattern scaling but here are a few key references:
This explainer can be cited as: RSS Climate Change Task Force. (2025). Explainer: How local warming is related to global warming – pattern scaling.
Royal Statistical Society. Available at:
https://rss.org.uk/policy-campaigns/policy/climate-change-resources/explainer-how-local-warming-is-related-to-global-w/