Past William Guy Lecturers
Beginning in 2023, the William Guy Lectureship moved from being in-person to being online-first, with lecturers recording talks as well as being available for in-person or live online sessions. Explore past recorded talks below. If you would like to contact a past lecturer, please email policy@rss.org.uk.
William Guy Lecturers 2023-2024 - Climate change and environmental statistics
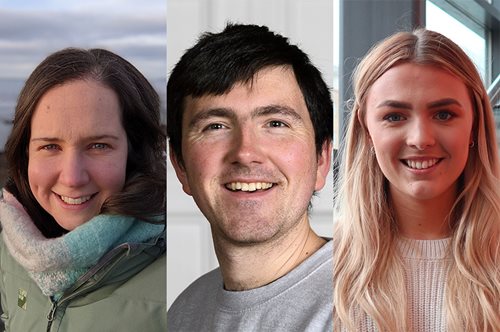
- Katherine Whyte, environmental statistician at Biomathematics and Statistics Scotland (BioSS), Edinburgh/Fife, William Guy Lecturer 2023-2024 for ages 5–11 – When we build wind farms, what happens to the wildlife?
- Craig Anderson, senior lecturer in statistics, University of Glasgow, Scotland, William Guy Lecturer 2023-2024 for ages 11–16 – Using statistics to monitor air pollution
- Eleanor D’Arcy, PhD student in statistics, Lancaster University, William Guy Lecturer 2023-2024 for age 16+ – How can statistics protect us against extreme sea levels resulting from climate change?
Take a look at further information on the talks and the videos.
William Guy Lecturers 2024-2025 - Statistics in plain sight
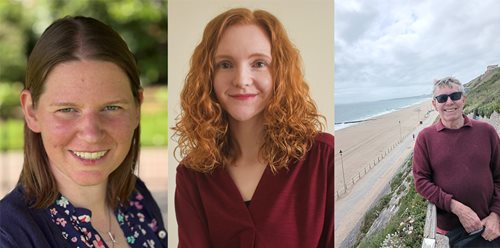
- Mary Gregory, Director of Population Statistics, Office for National Statistics, London, William Guy Lecturer for ages 5–11 – From sweets to streets: Understanding the world through statistics
- Nicola Rennie, Lecturer in Health Data Science, Lancaster University, William Guy Lecturer for ages 11–16 – From lab to patient: how statistics shapes decisions in medical treatment
- Mike Campbell, Emeritus Professor of Medical Statistics, University of Sheffield, William Guy Lecturer for age 16+ – Can I really believe that number? Statistics and Covid-19
Take a look at further information on the talks and the videos.