Talks to the LGC
January – There was no talk in January.
1. February 19th, 2025, Peter Froggatt Centre , QUB .
Mr. Jack Moore of the University of Limerick. Ireland gave a talk to the Local Group entitled:
Penalised Piecewise Exponential Distributional Regression Model for Survival Analysis

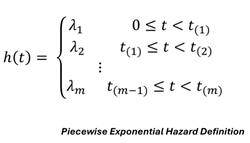
Jack introduced the topic by giving a brief review of basic Survival Analysis concepts before moving to the Piecewise Exponential model introduced by Friedman 1982. The main advantage of this model was the potential flexibility of the semi-parametric hazard function. Most models impose conditions of the shape which the hazard function can take over time. For example, in the Exponential survival model the hazard function is constant, while in the Weibull model the hazard can wax or wane or remain constant and in Cox's model the hazards in different groups are assumed proportional. In the Piecewise Exponential model, however, the form of the hazard is shown in the figure opposite as a series of
m (=10, typically) constant pieces whose shape over time is determined by the data. Accordingly, this approach is more flexible in principle. The Likelihood for this model is

where
λ is a vector of the
λs. Interval-specific covariates may be included by re-parametrizing as :

which leads to a large number of potential parameters (10 x (p+1)). Jack reduced these by attaching an Adaptive Lasso penalty to (1) which encouraged the fusing of intervals with similar values of the components of
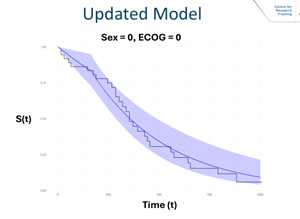
λ. In the example cancer data analysed, the number of parameters were reduced from 30 to 6 and the resultant fit is shown in the figure below.

where, for the particular covariate values given above, the jagged curve is the KM plot and the smooth curve is the Penalised Piecewise Exponential which has only two pieces due to the penalisation.
Jack's talk was very well received by an appreciative audience which thanked him in the usual way. He was asked questions on comparisons with other methods of penalisation (such as splines) which he not yet explored and questions on the Adaptive Lasso which he said worked well in practice, noting that. as he had mentioned in the talk, the standard Lasso penalty led to biased estimates.
There being no other questions the Chair closed the meeting thanking the speaker again and everyone for their attendance and contributions.
Key References
Friedman, M. (1982). Piecewise Exponential Models for Survival Data with Covariates.
The Annals of Statistics, 10(1), 101–113.
Jaouimaa, F. Z., Do Ha, I., & Burke, K. (2023). Penalized variable selection in multi-
parameter regression survival modeling. Statistical Methods in Medical Research, 32(12),
2455-2471.
2. March 19th, 2025, Peter Froggatt Centre , QUB .
Dr. Anthony Webster of the Department of Statistics, Oxford University, UK, gave a talk to the Local Group entitled:
Multistage models of multimorbidity, cancer, and neurodegenerative disease
Multistage models were developed in the 1950s as a mathematical model for the accumulation of genetic mutations that can lead to cancer. More recently they have been applied to a range of neurodegenerative diseases including Amyotrophic Lateral Sclerosis (ALS), Parkinson’s, and Alzheimer's.
These studies have been followed by a comprehensive survey of diseases in UK Biobank, that was motivated by the discovery that somatic mutations may be involved in many more diseases than just cancer. The study used two simple multistage models to describe the age-dependent incidence of 400 common diseases affecting men and women [1].
By providing a simple statistical correction to account for the limited age-range in cohort studies such as UK Biobank, it was found that approximately 60% of the diseases studied were consistent with a multistage disease process [1]. The parametric age-dependent model allowed late-onset diseases that are increasingly inevitable with age, to be distinguished from more sporadic diseases with a low risk that increases slowly with age. From a statistical perspective, the sporadic diseases might in principle be avoided over a lifetime, but the late-onset diseases appeared to become increasingly inevitable with increasing age.
The multistage model can allow mechanistic insights to be obtained by studying differences between stratified data [1]. Differences between plots can be interpreted as changes in the rates of underlying processes, changes to the number of rate-limiting steps needed for disease, or different underlying causes of disease.
More recently [2], the model has inspired a simple statistical test for whether two diseases share a first step that is necessary for both diseases. It is widely believed that there are shared underlying pathways that can lead to several disease types (a shared “pathogenesis”).
If true, this may help to explain clusters of disease types and the growing burden of multimorbidity (multiple diseases concurrently within an individual). This hypothesis can now start to be tested using data on disease incidence. Overall, the approach provides new biologically-motivated tools for using observational data to study diseases and to characterise disease risk.
This was a very wide-ranging and accomplished talk on multi-stage disease processes and modelling, which Anthony gave with some aplomb. A most appreciative audience thanked the speaker in the usual way. The substance of the talk provided much food for thought. Anthony was asked how this apparent mult-stage synthesis could help with identifying causal risk factors in the indidual diseases studied. Anthony replied that was largely an open question, but this project provided a useful framework from which to generate hypotheses and mount further studies.
When the discussion paused, the Chair closed the meeting thanking the speaker again and everyone for their attendance and contributions.
References
[1] "Multi-stage models for the failure of complex systems, cascading disasters, and the onset of
disease", A.J. Webster, PLOS One, 14 (5), e0216422 (2019).
[3] "Sporadic, late-onset, and multistage diseases", A.J. Webster, R. Clarke, PNAS Nexus, 1, 3, pgac095 (2022).
[2] "Characterisation, identification, clustering, and classification of disease", A.J. Webster, K. Gaitskell, I. Turnbull, B.J. Cairns & R. Clarke, Scientific Reports, 11, 5405 (2021).
[4] "Causal attribution fractions, and the attribution of smoking and BMI to the landscape of disease
incidence in UK Biobank", A.J. Webster, Scientific Reports 12, 19678 (2022). M
[5] “How much disease-risk is due to old age and established risk factors?”, A.J. Webster, PNAS Nexus, 2, 9, pgad279, (2023).
[6] “Relative risks, the probability of necessity, and attributable fractions”, A.J. Webster,
medRxiv 2024.07.03.24309898, (2024).
[7] “A simple multistage theory for multimorbidity”, A.J. Webster, https://arxiv.org/abs/2501.18742, (2025).
3. April 2025, Maths and Physics Teaching Centre, QUB
Prof. Gilbert MacKenzie, formerly of Centre for Biostatistics, University of Limerick and CREST, ENSAI gave a talk to the Local Group entitled:
Reducing Multicollinearity in GLMs with categorical covariates
Professor MacKenzie noted that often we have GLM regression models with many categorical covariates and that these are modelled using contrasts among the regression parameters. Several schemes are available, but today's talk is focussed on the “Reference subclass" method in which, for each categorical covariate, one regression coefficient of one subclass is set to zero and this is referred to as the 'Reference Subclass' for that covariate. The effect of the other subclasses are measured relative to this reference. Clearly, if the number of observations in the reference subclass is small it may serve as a poor reference category and result in unstable or inestimable models via
multicollinearity arising from near linear dependence of the columns of the design matrix,
X of, say, order (
n x
p). Such multcollinearity can lead to variance inflation and a consequent loss of precision.
Concentrating first on the Linear Model (LM) with a single categorical covariate with
p subclasses, Gilbert showed that the variance-covariance matrix,
Vr(β), was reference subclass dependent (hence the subscript 'r'), thus choosing different reference subclasses resulted in different variance-covariance matrices. It order to track these changes he chose, as a measure of variance
Tr=trace[
Vr(β)], the sum of the diagonal elements of
Vr(β), and designated it 'Total Variance'. Next he claimed that
Tr was minimised when the reference subclass chosen was the one with most observations in the
p subclasses, say
r_max. So that
Tr_max was optimal in this sense. Next he wondered about multicollinearity and chose, as a measure, the Condition Number defined as
K(M) = √[(λmax/ λmin)] where
M is a square matrix and
(λmax/ λmin) is the ratio of the largest eigenvalue to the smallest. Again, the condition number is reference subclass dependent and we use
Kr(X'X) =
√[(λr,max/ λr,min)] since, conveniently,
Kr(X'X) =
Kr(Vr(β)), but the former is easier to compute.

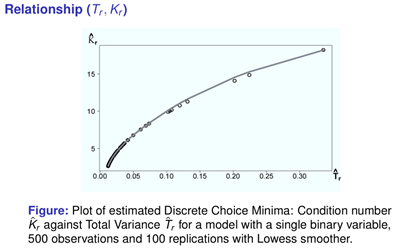
Next Gilbert explored the relationship between
Tr and
Kr in the LM case with one categorical variable and found that minimising
Tr also minimised
Kr' (See Figure). Thus,
Kr could be controlled via
Tr. This is true for a single categorical covariate in the LM case. But the computations for studying more complicated models analytically are intractable and so further progress requires simulation.
The first generalisation is to the general linear model with
m categorical covariates. Using the same logic as above and a vector,
n_max, of
m maximal subclass numbers he
conjectured that the use of
n_max, in
(Tn_max,, Kn_max) would lead to viable estimators of the discrete choice minima (
Tmin,, Kmin). These latter quantities can always be found by a direct search of all possible reference subclasses (e.g., for a model with 3 categorical variables having 2, 3 and 4 subclasses respectively, the search is over 24 posssibilities).
The next generalisation was to consider other types of GLM. After some work it can be shown that we can replace
n_max,with
w_max where these are the maximal GLM specific product-weights defined as
nr x
φ(β0) and thus in general we can use
(Tw_max,, Kw_max) to estimate the discrete choice minima (
Tmin,, Kmin). The proposed estimators turn out to be rather good having a high probability of attaining the minima exactly (discrete problem) with very low bias (typically <1\%).
Gilbert demostrated the findings with detailed simulation tables followed by a real data analysis using a logistic model. The simulation showed that for
any logistic model with 5 categorical covariates comprising of 4 × 5 × 4 × 3 × 3 subclasses (= 720 possibilities) and a sample size of c1000 the Pr(
Kw_max = Kmin) = 0.94. He computed
Kmin - 7.98 by direct search and found that the estimator
Kw_max also attained this minmum value. The use of the subclasses used by the original researchers produced a value of
Koriginal = 20.06. Thus, the use of
Kw_max reduces the measure of multicollinearity by more than half.
Frequently,
Kn_max = Kw_max when the GLM weight function,
φ(β0), is near 1 and this means that the use
Kn_max is generally a good strategy as it is found, simply, by inspection. In the example analysed above,
Kn_max produced the same result as
Kw_max. Gilbert also showed that the method works well when the model contains a mixture of continuous and categorical variables.
The talk was well received. There was a question on computation to which Professor MacKenzie responded saying that in the paper there were links to R algorithms to compute the discrete choice minima for any model and to an algorthm which computed the global minimum (typically unobtainable as involved unobserved quantities). He thought that the purveyors of Statistical Software packages might be interested in the method.
At the end of the discussion Dr. Hannah Mitchell, who had Chaired, drew the meeting to a close and thanked everyone for their attendance and contributions.
Key References
Peng D, MacKenzie, G. (2014). Discrepancy and choice of reference subclassin categorical regression models. In: Statistical modelling in biostatistics and bioinformatics—selected papers. Springer, Heiderberg
Peng D. MacKenzie, G. (2024). Reducing multicollinearity in GLMs with categorical covariates,
Metrika,
https://doi.org/10.1007/s00184-024-00980-2, .
Professor Gilbert MacKenzie
28/05/2025.