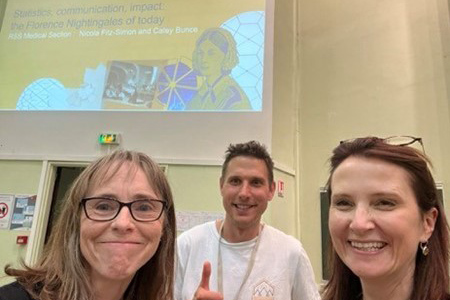
On Monday 13th June 2022 this session was held in Lyon at the 53èmes Journées de Statistique de la Société Française de Statistique (SFdS) organised by Dr Catey Bunce (NIHR BRC at the Royal Marsden NHS Foundation Trust and the Institute of Cancer, London) and Dr Nicola Fitz-Simon (NUI Galway) on behalf of the Medical Section of the RSS. This was one of a series of events that had been planned to take place as part of the celebrations for the 200th anniversary of the birth of Florence Nightingale in 2020 which had to be postponed as a result of the Covid pandemic.
The session was chaired by Dr Catey Bunce who started her talk with a thanks (in French and English) to the SFdS for their kind invitation to attend.
Dr Bunce then spoke to her talk, 'Tips for applied medical statisticians from Florence Nightingale - Data visualisation'. Dr Bunce alluded to challenges that she had experienced as an applied medical statisticians surrounded by clinicians, as a woman surround by many men and struggles communicating important messages from her analyses beyond the statistical community. Florence Nightingale had clearly overcome such issues in a harder environment so what might Dr Bunce learn from FN and if Dr Bunce could learn something might she be able to hand this on to other statisticians earlier on in their careers.
Tips identified included:
- Data visualisation is very important in the communication of statistical concepts to non-statisticians. The image that speaks best to your audience might not be the one that you as a statistician believe is best.
- If you want your research to have impact, think very carefully in relation to publication.
Dr Bunce talked the audience through the polar chart created by Nightingale that had persuaded medics and the army to change practice and then showed how others had turned to Nightingale in the Covid pandemic in order to better communicate statistical messages. She finished her talk with a reflection of lessons learned during the pandemic and reminded all of Harford’s Rules of thumb and the 'Covid Lessons learned' memo produced by the Royal Statistical society.
The next talk was given by Dr Roger Beecham (School of Geography, University of Leeds) titled 'Scientific reform and visual data science: Retiring the EDS/CDA Dichotomy'. Dr Beecham commented on how concerns about the replicability of published scientific findings has prompted much introspection in the way in which scientific knowledge is produced. To address issues such as data fishing, searching exhaustively for discriminating patterns in a dataset, picking and then publishing those that are statistically significant, an argument is made that research findings should only be claimed through pre-registered confirmatory data analyses. Pre-registration studies are, though, somewhat inimical to the more informal research environments typical of modern applied data analysis 'Data Science'. Dr Beecham discussed these issues and demonstrated through an analysis of road crash data in the UK, how nascent visualisation techniques can be used to navigate and inject statistical rigour into contemporary data analysis environments.
The final talk was given by Dr Victoria Cornelius (Imperial Clinical Trials Unit, School of Public Health, Imperial College London). Dr Cornelius spoke in relation to the analysis and presentation of adverse events (AE) in clinical trials and presented a new approach to visualise data for a Covid-19 trial. The visualisation, based on a radial graph readily enabled readers to compare harms observed using different vaccine strategies and to explore how this varied by age. To her talk she added a tweet with an impassioned plea for AE in RCTs.
The session ended with applause, thanks to the speakers and to Dr Catey Bunce and Dr Nicola Fitz-Simon of the RSS Medical Section for organising the session and thanks from Dr Bunce to the scientific committee of SFdS for their very kind invitation.
