Explainer: Extreme weather
The RSS has launched a series of explainers on the statistics and data underpinning our understanding of climate change, led by the RSS Climate Change and Net Zero Task Force.
This second set focusses on extreme events and explains why a small increase in the global mean temperature can lead to a disproportionate increase in extreme events.
1. What is an extreme weather or climate event?
An extreme weather or climate event is one whose intensity is unusually large for the time and place where it occurs. Examples of phenomena that create weather-related extremes include severe storms, heavy rainfall and floods, droughts, heat waves, and wildfires. As reported by the Intergovernmental Panel on Climate Change (IPCC) Sixth Assessment Report, the measure of intensity depends upon context, e.g., maximum wind gust speed for hurricanes, accumulated rainfall totals, maximum or minimum daily temperatures.
Events are often considered to be extreme if the chosen measure exceeds a given high value eg, a day with a maximum temperature above some large threshold value. There are various ways to choose the threshold:
- an absolute value above which large impacts are known to occur, eg 40°C;
- a large value that is only rarely exceeded, eg the value that has been exceeded only 5% of times in past records;
- the maximum of all previous records, in which case the threshold increases over time and the extreme events are then record-breakers.
Extreme events are also sometimes defined not as threshold exceedances, but as events that take the most extreme value in specified time periods, eg the hottest day in each year.
2. Why is there a lot of concern about changes in temperature and other weather extremes?
Our society and the living systems around us are generally not well-adapted to infrequent yet extreme weather and climate events. Our health and our infrastructure are particularly sensitive to events that have not been experienced before.
The World Meteorological Organization has estimated that extreme weather and climate events have resulted in 12,000 reported disasters between 1970 and 2021 causing over 2 million deaths and $4.3 trillion in economic losses. These losses and irreversible stress and damage to other living species (eg coral bleaching) are expected to rise with more frequent and more intense extreme events caused by ongoing global warming.
3. Why are extremes so sensitive to global warming? After all, a 1.5°C increase in mean temperature does not seem very large.
Small changes in the mean can lead to disproportionate increases in the number of extreme events. For example, at Heathrow airport (London, UK), an average increase of 1.4°C has led to a relative increase of 60% in the number of days with maximum temperatures above 25°C (from an average of 18.6 days per year over 25°C in 1960-1991, to 29.8 days per year over 25°C during 1992-2023).
Let’s look at this in more detail. The figure below shows daily maximum temperatures observed at Heathrow airport (London, UK) in the period 1960-2023 (data source: http://www.ecad.eu). The temperature extremes (highlighted here above 25°C) in the more recent half of the record (red dots) can be seen to be generally greater than in the earlier half of the record (blue dots).
Daily maximum temperatures at Heathrow have become more extreme 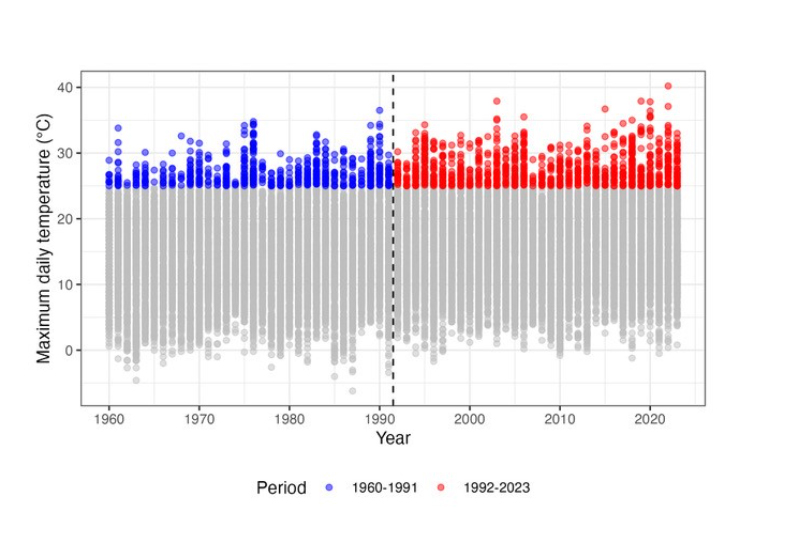
Figure 1: Maximum daily temperature at London Heathrow airport from 1960-2023. The colours show the extremes above 25℃ over the periods 1960-1991 (blue) and 1992-2023 (red).
Below we show the distribution of daily maximum temperatures for the earlier period (1960-1991, blue curve) and for the more recent period (1992-2023, red curve). The distribution allows us to assess the frequency of occurrence of various temperature values: higher points on the curves are at temperatures that occur more frequently. The two peaks reflect the different temperature distributions in the winter and summer.
The distribution has shifted to the right over time, illustrating that the more recent period is slightly warmer than the earlier period. The average daily maximum temperature was 15.8°C (red dashed line) in the more recent period 1992-2023 and 14.4°C (blue dashed line) in 1960-1991 – a small yet significant increase of 1.4°C.
There has been a shift towards warmer daily maximum temperatures at Heathrow
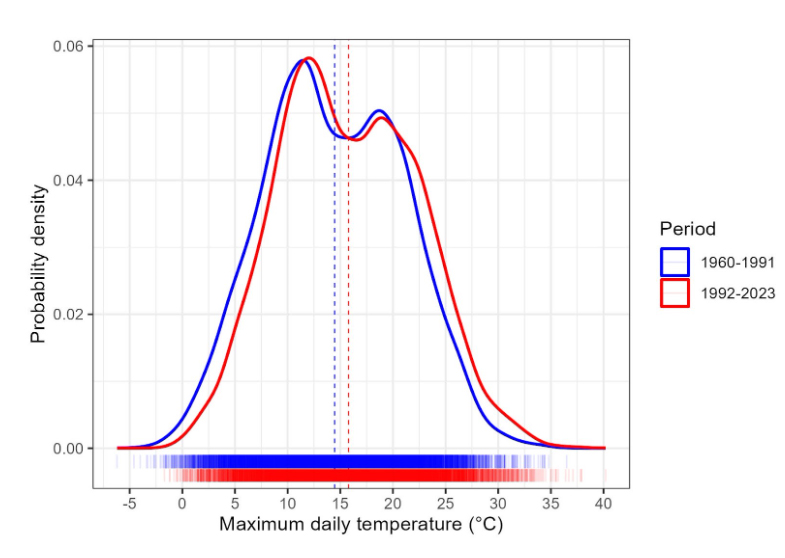
Figure 2: Distribution of daily maximum temperatures at London Heathrow airport from 1960-2023. The colours show the periods 1960-1991 (blue) and 1992-2023 (red). The vertical dashed lines are the average temperatures over the two periods. The horizontal bars show the individual daily temperature data.
The above shift has notable consequences on the frequency of more extreme values, which form the so-called ‘tail’ of the distribution. If we consider ‘extreme’ days that reach at least 25°C, then we find an average of 18.6 extreme days per year in the period 1960-1991, and 29.8 extreme days per year during 1992-2023. In other words, an average increase of 1.4°C has led to a relative increase of 60% in the number of days above 25°C, making such extremes far more common.
This increase in number of extremes also occurs for higher thresholds (when we consider a temperature above 25°C, eg 28°C or 30°C, to be ‘extreme’). This can be seen in the figure below, which shows the number of days above a range of different temperature thresholds for the earlier versus later period.
The number of very hot days each year has greatly increased
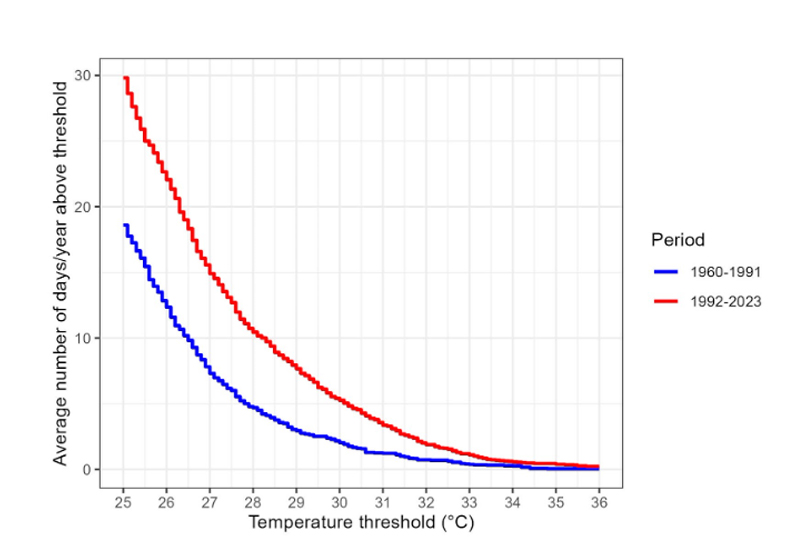
Figure 3: Average number of days per year with daily maximum temperature over a given threshold at London Heathrow airport. The colours show the periods 1960-1991 (blue) and 1992-2023 (red).
The distribution of Heathrow temperatures is mainly characterised by a shift towards warmer temperatures, as we can see in Figure 2. However, distributions of weather-related variables can also undergo changes in width and even shape due to other mechanisms associated with climate change, which can have an even greater effect on extremes. Rainfall is a good example of this, where more winter floods and summer droughts are predicted in the UK even though annual average rainfall is predicted to show only a small change.
4. We talk about the 1 in 100 year event, but then several come along in one year or in consecutive years. Why does that happen and how might global warming change it?
The occurrence of extreme events depends on many unpredictable factors and so the number each year should not be expected to follow any regular pattern. This randomness means that there can easily be years that have many events and years also with very few events.
This apparent clustering is a natural feature of such random processes. A 1 in 100 year event means that events this, or more, extreme are expected to occur on average at a rate of 1 event every 100 years. However, this can also be realised by several events in successive years followed by a considerable delay before any other events.
Global warming is expected to substantially change the rate of extreme events, which in turn changes the distribution of the number of extreme events per year. As an example, the figure below shows, for Heathrow, how the number of days per year with maximum temperatures exceeding 25°C changes between 1960-1991 (blue line) and 1992-2023 (red line).
In the earlier period (1960-1991), 6 out of 32 years had 30 days or more of temperatures above 25°C whereas in the later period (1992-2023) there were 14 out of 32 years having 30 days or more of temperatures above 25°C. So, a small 1.4°C difference in mean temperature is associated with a large 133% increase in the number of years having more than a months’ worth of hot days.
The risk of having many hot days each year at Heathrow has greatly increased
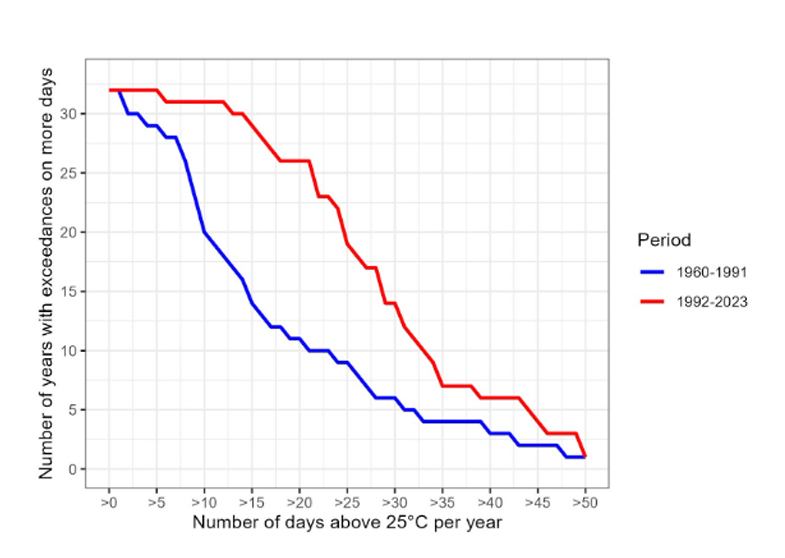
Figure 4: Number of years with more days above 25℃ than the number of days specified on the horizontal axis, at London Heathrow airport. The colours show the periods 1960-1991 (blue) and 1992-2023 (red).
This explainer has been reproduced in
Significance magazine: Stephenson, D.B., Garrett, A., Domingo, D. (2025) Extreme weather: A climate change explainer,
Significance, Volume 22, Issue 3, May 2025, Pages 13–15,
https://doi.org/10.1093/jrssig/qmaf022
This explainer can also be cited as: RSS Climate Change Task Force. (2025). Explainer: Extreme weather.
Royal Statistical Society. Available at:
https://rss.org.uk/policy-campaigns/policy/climate-change-explainers/explainer-extreme-weather/