Explainer: Climate change attribution of extreme events and trends
1. What is meant by climate change attribution?
Climate change attribution is the scientific process of determining the extent to which human activities have influenced past weather events and climate trends. Attribution seeks to determine whether, and to what extent, human influence has increased the likelihood or intensity of a particular event or trend, compared to a scenario without human-induced climate change.
A combination of statistical and climate models is used to separate out the causal effects of human actions (eg greenhouse gas emissions, land use changes, etc) from natural drivers of climate (eg El Niño-Southern Oscillation, solar activity, volcanoes, etc).
2. How is extreme weather event attribution done?
Extreme event attribution aims to determine human influences on specific historical extreme weather events such as floods, heatwaves, and storms. Climate scientists use observational data as well as information from climate model simulations to assess how much human-induced climate change might have affected an observed extreme event.
- Statistical analysis: historical observations are analysed to determine if and how the frequency or intensity of such extreme events has changed over time. Statistical modelling is then used to quantify how the distribution of extremes of a hazard variable such as precipitation, temperature, or wind speed in a region depends on key indicator variables such as global mean temperature.
- Climate modeling: scientists run climate models with and without human-caused greenhouse gas emissions to compare the likelihood or intensity of an extreme event occurring in each scenario.
As an illustration, consider attribution of the annual maximum daily temperature of 35°C that was observed in 2018 at Heathrow airport (see Figure 1 left panel; data described in our explainer on extreme weather, available
online and in Significance 2025, 22:3, pages 13–15). In the left panel of Figure 1, it can be seen that 35 °C was only exceeded once during the earlier period 1960-91, whereas it was exceeded six times in 1992-2024. If we assume that the difference between the two periods is only caused by human factors, we can attribute the increasing frequency of these exceedances (from 1/32 to 6/33) to human influence on the climate.
The right panel of Figure 1 shows a positive relationship between the annual maximum temperatures at Heathrow and the global mean warming trend in each of the years. Annual maximum temperatures at Heathrow are increasing at about 5°C for every increase of 1°C in global mean warming. Statistical modelling of this relationship – performed using extreme value distributions, a statistical tool for analysing the probability of rare events – allows quantitative estimates to be made of how the probability of exceeding 35 °C depends on global mean warming. For example, running simulations with random variations around the trend in the right panel of Figure 1 gives estimates that the probability of exceeding 35 °C was 4.5% in 1975 but is now 41.5% in 2025.
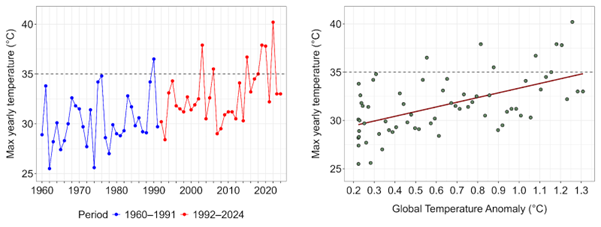 Figure 1. Left panel: Time evolution of the annual maximum daily temperature at London Heathrow, shown over two periods of 32 and 33 years, respectively: 1960-1991 (blue) and 1992-2024 (red). Right Panel: Annual maximum daily temperature at Heathrow versus the global mean warming since pre-industrial (1850–1900). The red straight line, fitted using linear regression, indicates the way that annual maxima increase with global mean warming. In both panels, the horizontal dashed line marks a 35 °C threshold.
More information and examples on attribution of extreme events can be found at the
World Weather Attribution site.
3. What does it mean to say that an extreme event was made more likely because of climate change?
A recent
BBC article stated that
“the heatwave that hit France in 2015 killing more than 3,000 people, [...] was made twice as likely because of climate change.”
Similar statements have been made about the floods in Valencia, and Storm Boris in Central Europe. Of course, an extreme event that is exceedingly rare can still be exceedingly rare even though it has become twice as likely.
In the French heatwave case, the researchers used the statistical methods outlined above in Q2. They fitted a statistical model to the data that determined how often extreme events occur under various levels of climate change. Even under no climate change, it is possible for these events to occur, and we can estimate how often. Under the climate change scenario though, the researchers found that these events occurred twice as often, and that is how they arrived at their figure.
It is important to note that estimates of the change in rate of extreme events invariably have a large uncertainty range. One cause of the large uncertainty is that extreme events are, by definition, rare. It can therefore be difficult to estimate how often such events occur with a limited data history. Uncertainty ranges are typically provided as part of research efforts, as shown in Figure 2, but are often omitted for simplicity from headline findings in news stories.
4. How is climate trend attribution done?
Climate trend attribution is assessed through a combination of climate and statistical modelling techniques:
- Detection of trends: statistical models are used to test whether trends in time series indices (eg global mean temperature) are beyond what would be expected by chance from natural variability of climate.
- Attribution of trends: statistical models are used to quantify how trends in climate time series indices are related to those obtained from sets of climate model simulations made with and without human-induced drivers (eg greenhouse emissions) but always including natural drivers (eg solar activity, volcanoes).
- Identification of optimal indices: to better understand how much of the observed climate change is caused by human activities, scientists sometimes create special indicators, known as optimal indices. These are designed to highlight the effects of climate change as clearly as possible. To do this, researchers compare real-world climate data with patterns expected from computer models that simulate what might happen under different levels of greenhouse gas emissions. By focusing on the parts of the data that match these expected patterns, they can more confidently detect the influence of human-driven climate change.
Figure 2 below shows global mean temperature (relative to the 1850-1900 pre-industrial average) based on observations and climate-model simulations with and without human drivers. All three solid lines are close to one another up until around 1930, but then after that the observed temperature and simulated temperature made using natural and human drivers start to diverge from the simulated temperature made using only natural drivers. Hence, the more recent trend in observed temperatures can be attributed to the effect of human drivers.
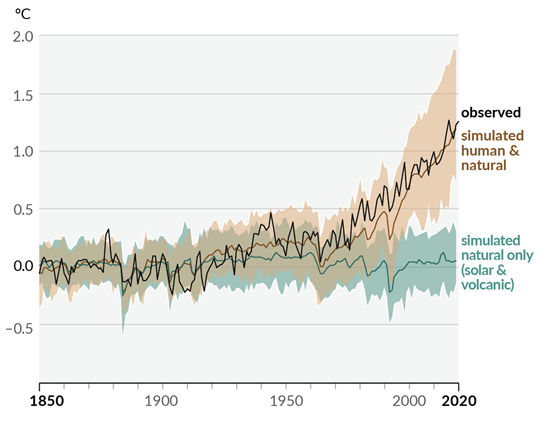 Figure 2. Time evolution of global mean surface temperature (black line) and simulated temperature using human and natural (brown line) and natural only (green line) drivers. The shaded bands quantify the uncertainty in the simulated temperature estimates. Source: Figure SPM.1(b) from the Intergovernmental Panel on Climate Change (IPCC) (2021) Summary for Policymakers (page 6).
5. Where can I find out more about climate change attribution?
There has been much published research on the topic of detection and attribution. Here are some key publications on the detection and attribution of trends:
Here are some key publications on detection and attribution of extreme weather events:
This explainer can be cited as: RSS Climate Change Task Force. (
2025). Explainer: Climate change attribution of extreme events and trends. Royal Statistical Society. Available at:
https://rss.org.uk/policy-campaigns/policy/climate-change-resources/explainer-climate-change-attribution-of-extreme-ev/