The RSS Statistical Ambassadors programme was set up in 2014 and we've trained three cohorts of ambassadors in public speaking and talking to the media about statistics. Here, RSS Chartered Statistician Anthony Masters reflects on his third year as a Statistical Ambassador for the Society.
Back in June 2018, the Royal Statistical Society chose me as one of their Statistical Ambassadors. The purpose is to help journalists, policy-makers, researchers, and the public understand statistics.
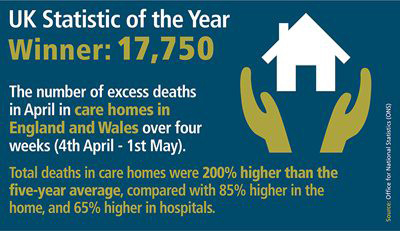
Statistics of the Year, with quality information
I helped with the RSS 2020 Statistics of the Year. I checked the submitted figures. As part of that work, I wrote quality and methodology information for each main entry.
Helping journalists during the pandemic
The Covid-19 pandemic persists. After the third national lockdown in England, the Huffington Post had a quote from me about case numbers.
I also helped the Press Association check statistics for some unusual causes of death. That was after a comment by Professor Reicher (Cambridge).
I also gave an interview to the BBC World Service on counting Covid-19 deaths:
Learning more about R
I have sought to improve my workflow in R.
This uses Claus Wilke's geom_hpline function (Image: R Pubs)
Over the past year, I have:
- Compared base and tidyverse functions in R.
- Written code to draw hospital admission and occupancy statistics straight from the Public Health England API. That code then creates an animated graph.
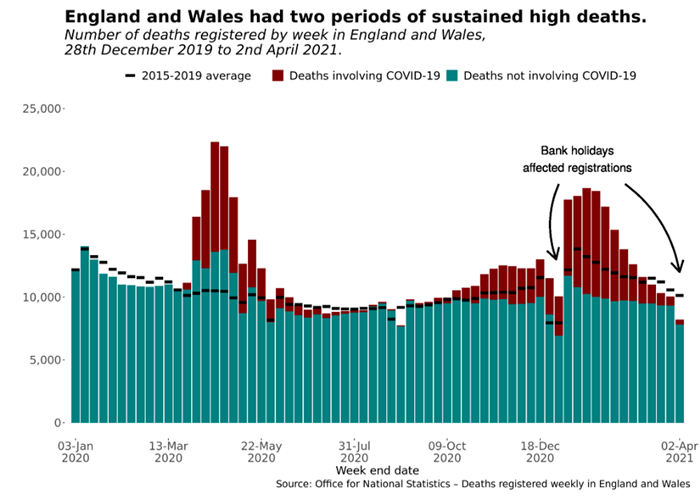
- Emulated two different Office for National Statistics graphs of death registrations.
- Made repeatable tables in R.
- Applied Bayesian statistics to the problem of A/B testing.
- Wrangled NHS England vaccination statistics from the online file.
My R code is on R Pubs and GitHub.
Posting on Medium
I maintain a Medium blog with regular updates on statistical topics. In the past year, the most viewed articles were:
- Deaths per Day Worldwide: A graph circulating on social media suggested there were only 56 Covid-19 deaths per day. It is unclear where the figures come from, but that statistic appears out-of-date.
- UK Polling on Black Lives Matter: A newspaper columnist asserted there were “no opinion polls available”. That was a false claim: I found UK (or GB) polls about Black Lives Matter.
- Vaccine Efficacy Estimates: News reports say that vaccines offer ‘95% protection’ or similar claims. This article looks at what those claims mean, and how to estimate uncertainty.
- There were over 600,000 death registrations in 2020: An erroneous image on social media claims there were only ~562,000 registrations in England and Wales. I correct that false claim.
- Understanding one in 100,000: I help readers visualise what one in 100,000 looks like. I also offer other events with similar incidence, including games of chance.
FAQs and The Observer articles
I began a fruitful collaboration with Prof Sir David Spiegelhalter. We wrote answers to frequently-asked questions about Covid-19 statistics on the Royal Statistical Society site.
Editors at the Sunday newspaper The Observer then offered Sir David a column. Since we worked well on the Covid-19 FAQs together, the Sunday articles became our shared endeavour.
The articles had several strict limitations. Due to copy space, the articles could only be about 350 words. There was no space for graphs nor helpful boxes. The audience was the general public, wishing to learn more about Covid-19 statistics. It is a challenging task: to distil large, complex topics to short, simple language. Sometimes, the subjects were too large for the article to do it justice. That was my fault as a co-author. On other occasions, some people misrepresented what the articles said. That was enraging, as my voluntary work seeks to inform.
I also gave a presentation to the Royal Statistical Society on communicating Covid-19 stats to the public:
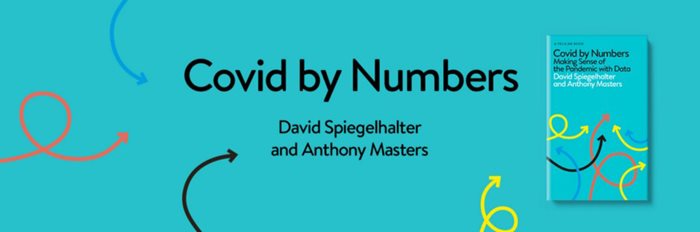
Covid by Numbers
From the ether of these articles arose the idea for a book. Since the start of the pandemic, news articles and items bombard us with numbers. This book aims to inform readers what those statistics, such as excess deaths, mean. Each chapter asks a question, which we seek to answer. There are many surprising facts and figures too.
Sir David and I worked for several months on this book, drafting and refining chapters. I created the initial versions of almost all of the graphs in R. This was a huge undertaking. We are at the proofing stage, and look forward to publication.
(Image: Penguin Random House)
You can pre-order the book, which comes out on 30 September 2021.
What next?
Over the next year, I want to:
- Build a Covid by Numbers website: I need to host the R code and information about data sources somewhere.
- Continue improving: I have lots of reading and coding to do. I am looking forward to reading more about Bayesian statistics, modelling, and survey research methods.
I really enjoyed working with other Ambassadors, and I hope the coming year is better for everyone.
This article is published on Anthony's blog at anthonybmasters.medium.com, reproduced with permission.